Table Pivot
Description
Used to convert long, narrow data tables into short, wide data tables. Selected columns are transposed, with the column names converted into values across multiple columns.
Perhaps the easiest example to understand is to think of a data table with months listed as rows:
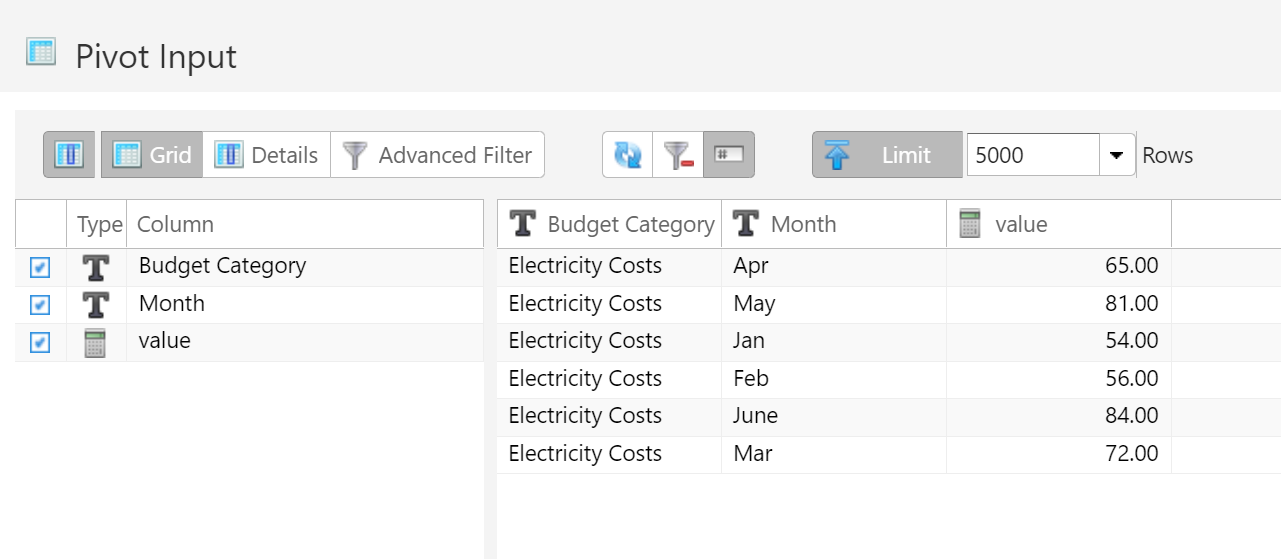
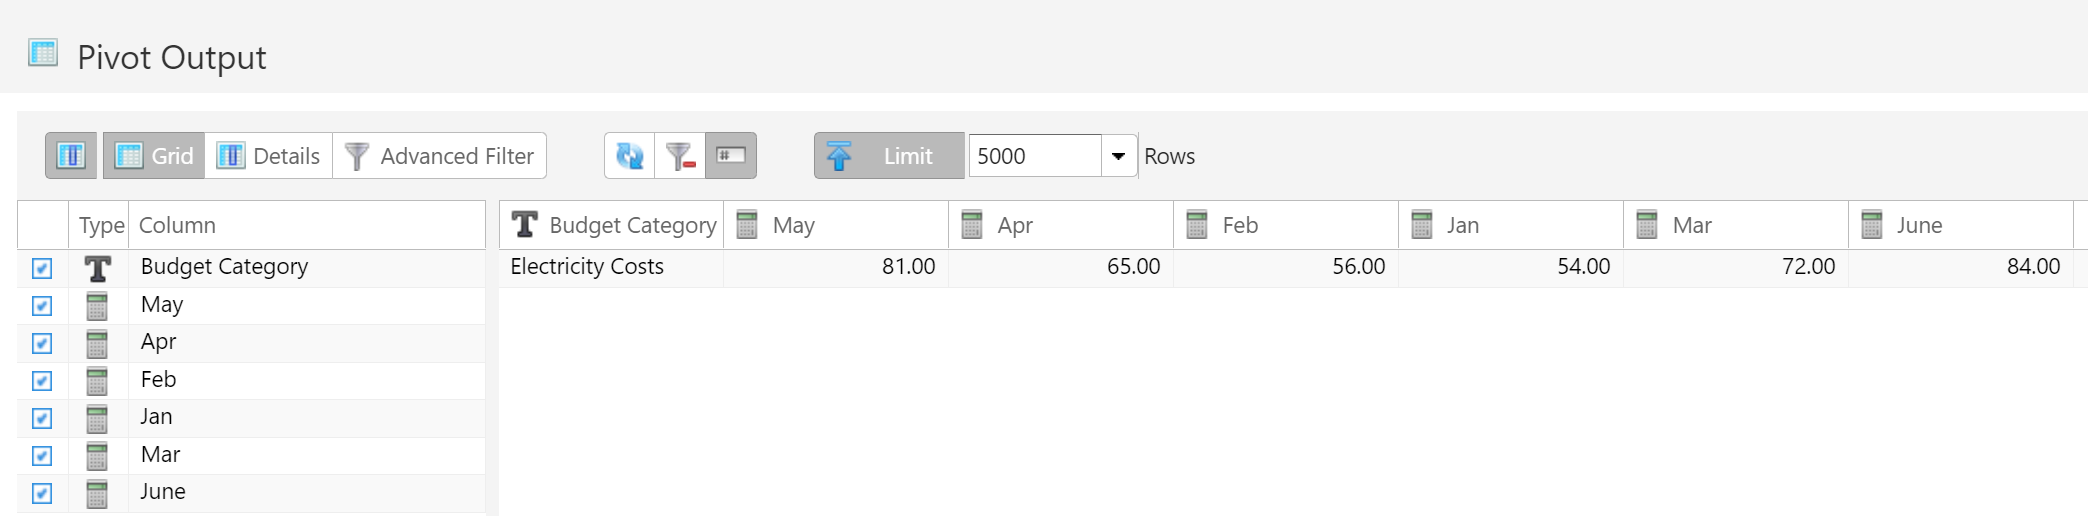
Pivoting this data table would convert all of the month rows into columns.
By specifying which columns to transpose and which columns to leave alone, this becomes a powerful tool. Making this conversion in other ETL tools could require a dozen more steps.
Source and Target Parameters
Source Table Selection
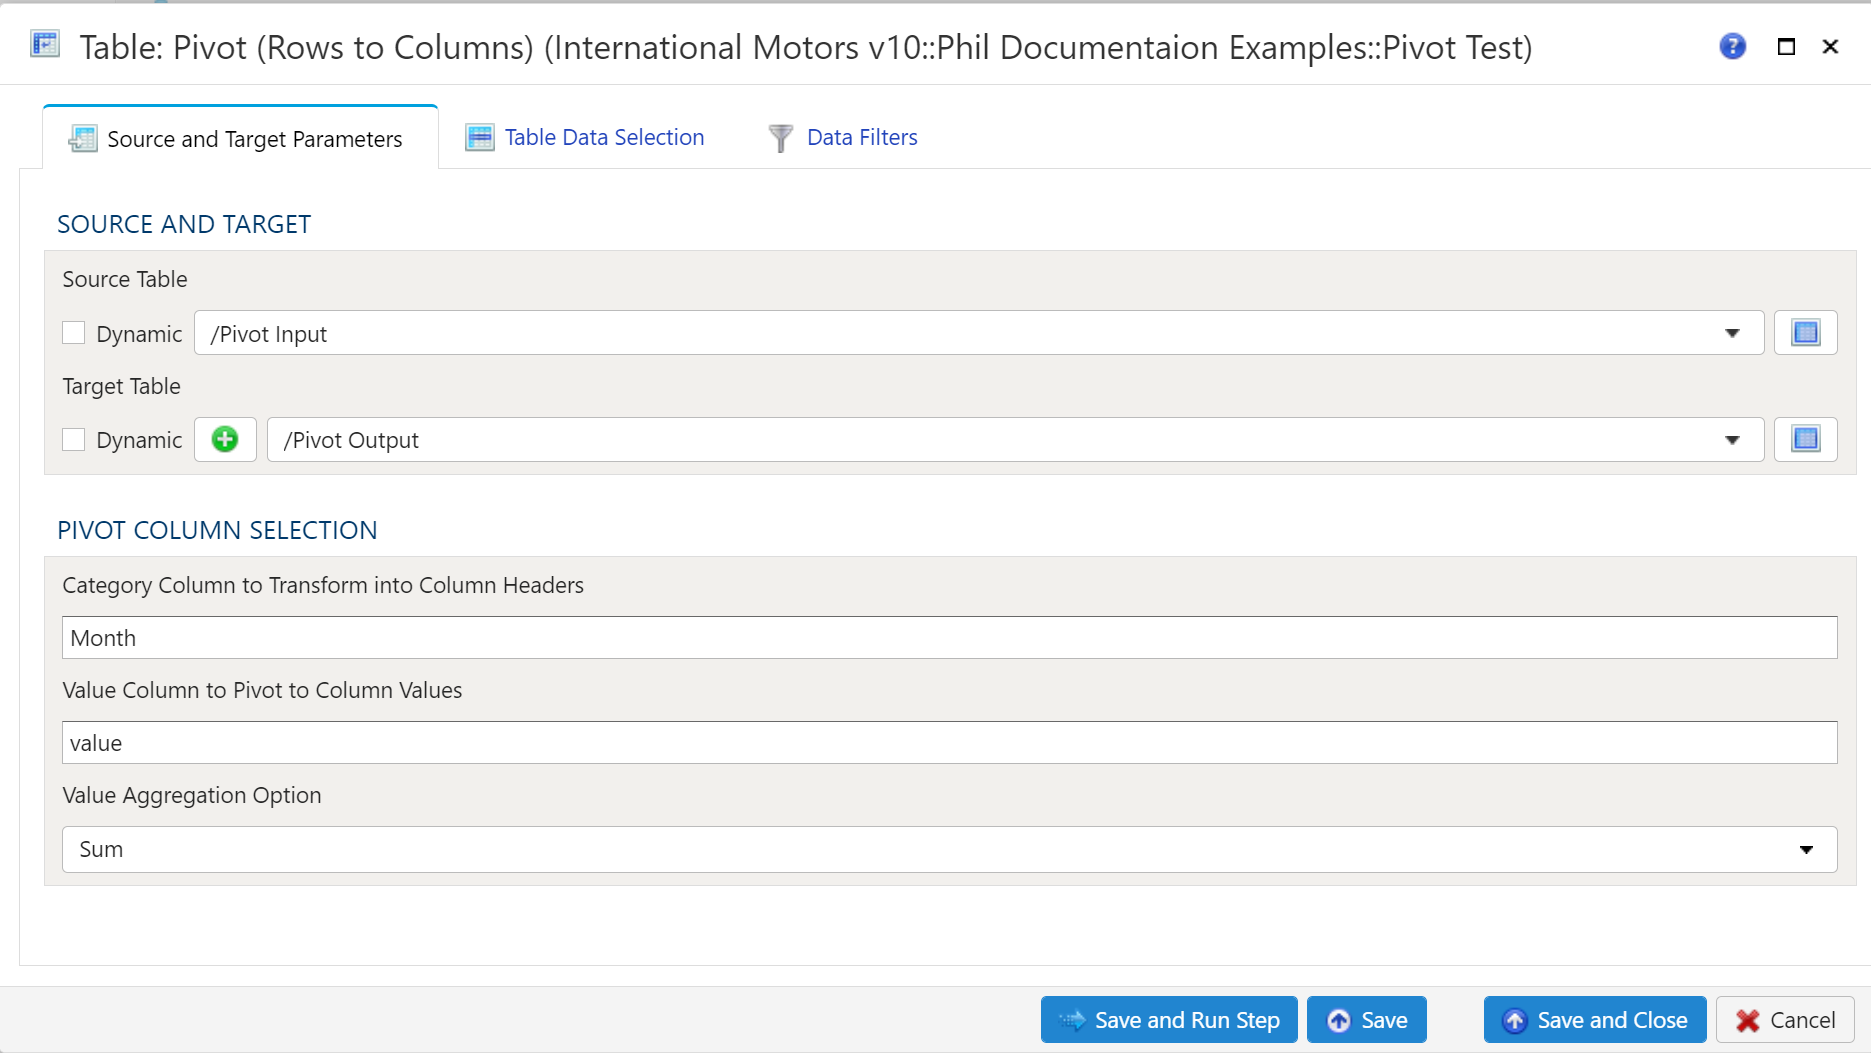
To establish the source and target, first select the data table to be extracted from using the dropdown menu.
Traget Table Selection
Target Table

To establish the target table select either an existing table as the target table using the Target Table dropdown or click on the green "+" sign to create a new table as the target.
Table Creation
When creating a new table you will have the option to either create it as a View or as a Table.
Views:
Views are useful in that the time required for a step to execute is significantly less than when a table is used. The downside of views is they are not a useful for data exploration in the table Details mode.
Tables:
When using a table as the target a step will take longer to execute but data exploration in the Details mode is much quicker than with a view.
Pivot Column Selection
The Category Column to Transform into Column Headers is where you specigy the column in Source Table that will be pivoted to rows. The Value Column ti Pivot to Column Vales is the column that containes the values in the Source Table. The Value Aggregation Option is where you specify how you want the data to aggregate.
Table Data Selection
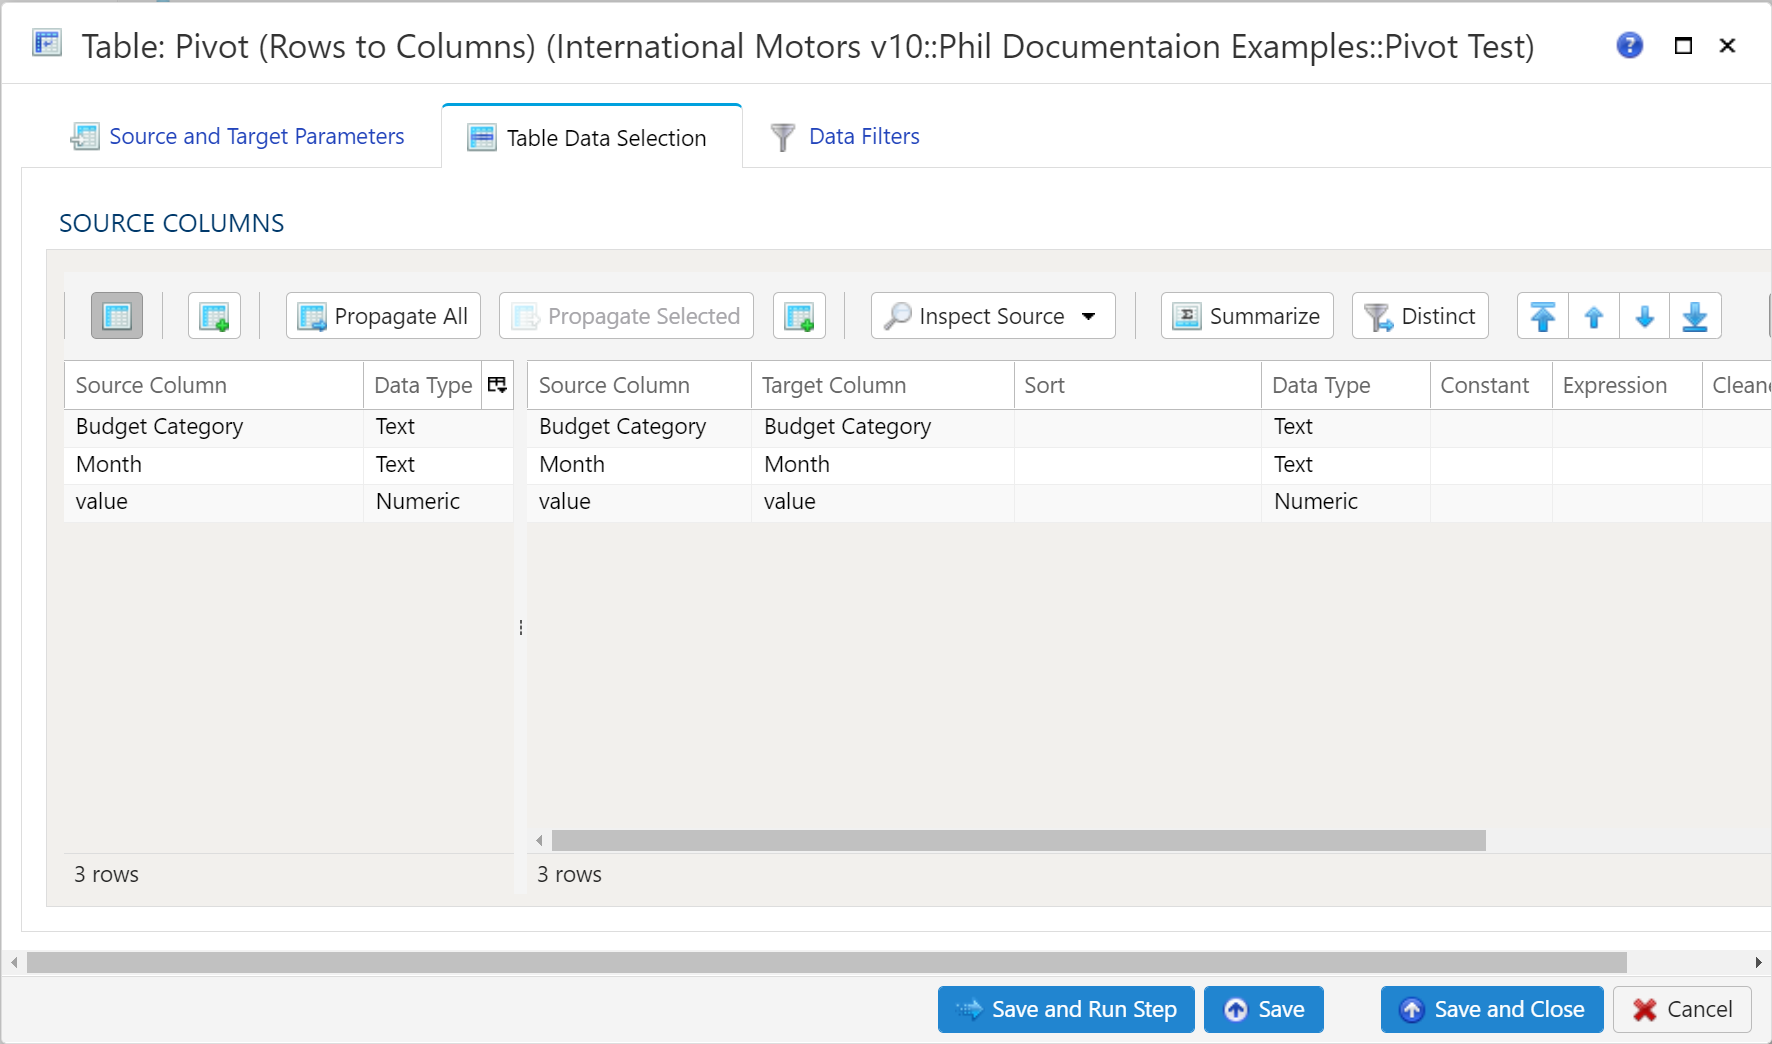
The Table Data Selection tab is used to map columns from the source data table to the target data table. All source columns on the left side of the window are automatically mapped to the target data table depicted on the right side of the window. Using the Inspect Source menu button, there are a few additional ways to map columns from source to target:
- Populate Both Mapping Tables: Propagates all values from the source data table into the target data table. This is by default.
- Populate Source Mapping Table Only: Maps all values in the source data table only. This is helpful when modifying an existing workflow when source column structure has changed.
- Populate Target Mapping Table Only: Propagates all values into the target data table only.
In addition to each of these options, each choice offers the ability to preview the source data.
If the source and target column options aren’t enough, other columns can be added into the target data table in several different ways:
- Propagate All will insert all source columns into the target data table, whether they already existed or not.
- Propagate Selected will insert selected source column(s) only.
- Right click on target side and select Insert Row to insert a row immediately above the currently selected row.
- Right click on target side and select Append Row to insert a row at the bottom (far right) of the target data table.
To delete columns from the target data table, select the desired column(s), then right click and select Delete.
To rearrange columns in the target data table, select the desired column(s), then right click and select Move to Top, Move Up, Move Down, or Move to Bottom.
To return only distinct options, select the Distinct menu option. This will toggle a set of checkboxes for each column in the source. Simply check any box next to the corresponding column to return distinct results only.
To aggregate results, select the Summarize menu option. This will toggle a set of drop down boxes for each column in the target data table. The following summarization options are available:
- Group by (set as default)
- Sum
- Min
- Max
- First
- Last
- Count
- Mean
- Median
- Mode
- Std Dev
- Variance
- Product
- Absolute Val
- Quantile
- Skew
- Kurtosis
- Mean Abs Dev
- Cumulative Sum
- Cumulative Min
- Cumulative Max
- Cumulative Product
For more aggregation details, see the Analyze overview page here.
Data Filters
To allow for maximum flexibility, data filters are available on the source data and the target data. For larger data sets, it can be especially beneficial to filter out rows on the source so the remaining operations are performed on a smaller data set.
Select Subset of Data
Any valid Python expression is acceptable to subset the data. Please see Expressions
for more details and examples.
Apply Secondary Filter To Result Data
Any valid Python expression is acceptable to subset the data. Please see Expressions for more details and examples
Final Data Table Slicing (Limit)
To limit the data, simply check the Apply Row Slicer box and then specify the following:
- Initial Rows to Skip: Rows of data to skip (column header row is not included in count)
- End at Row: Last row of data to include. This is different from simply counting rows at the end to drop