Rule-Based Tagging
Description
Rule Based Tagging is used to add attributes contained within a dimesion to a data table.
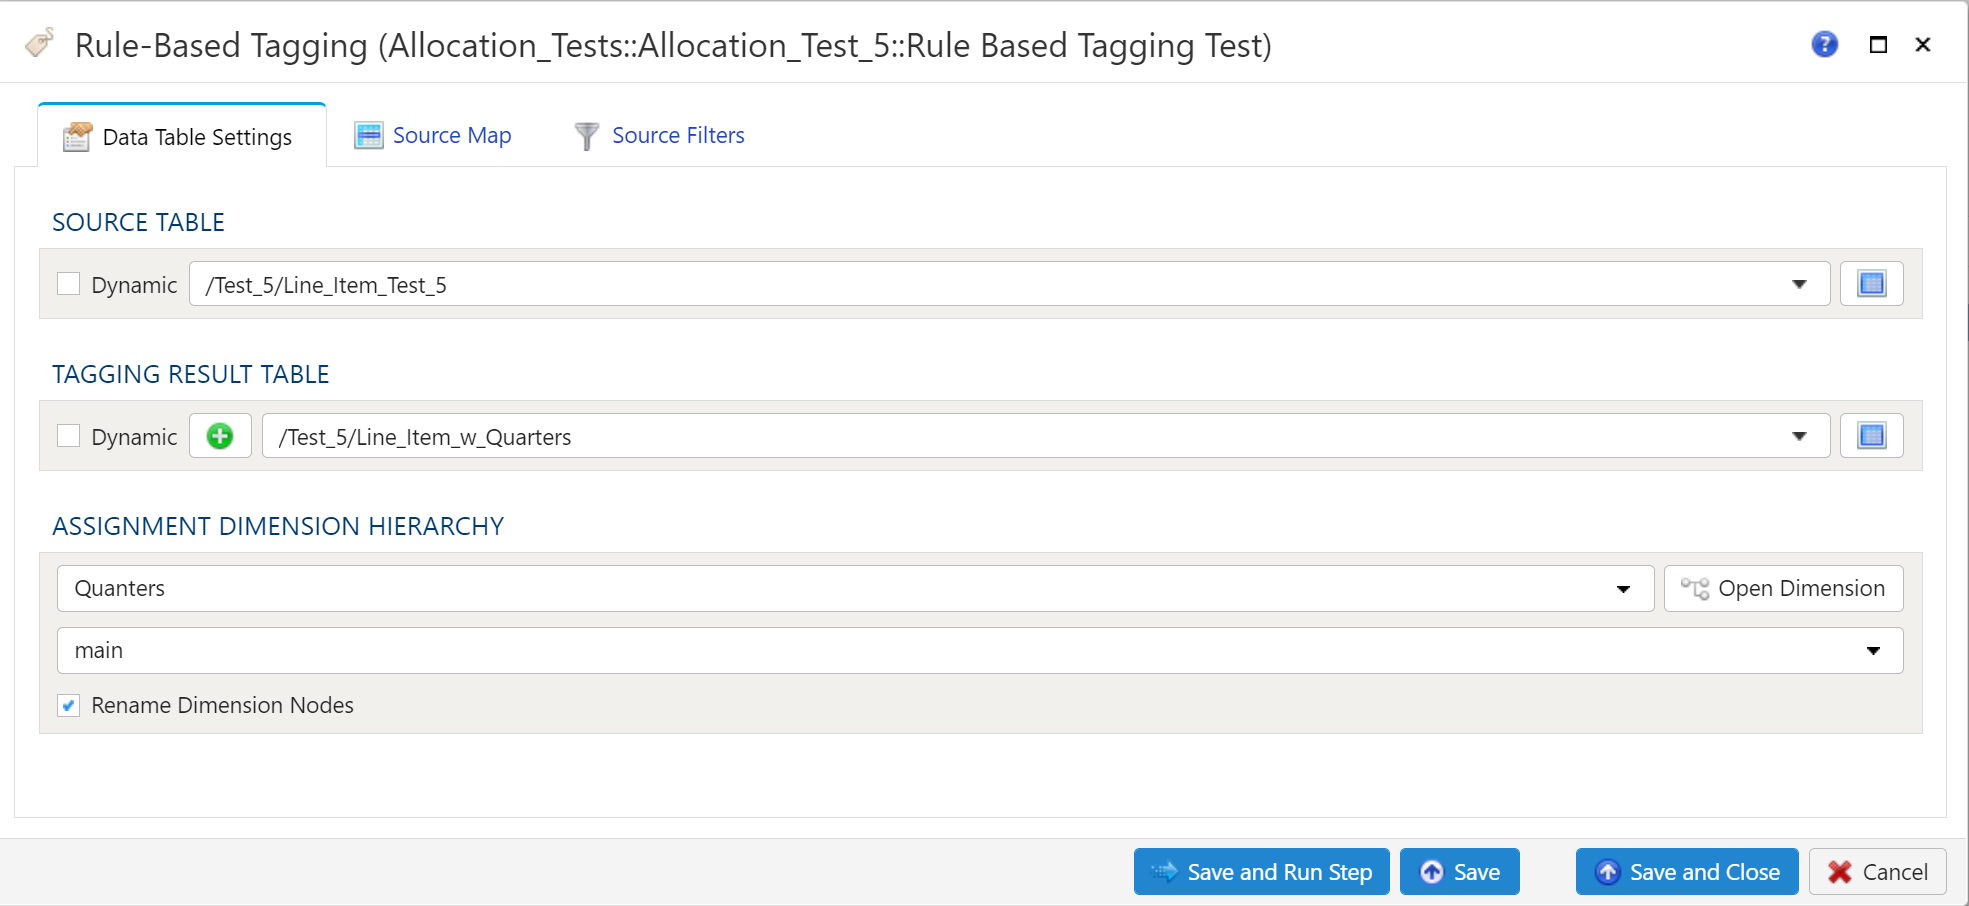
Data Table Settings
The Source Table and Tagging Result Table can be selected dynamically or statically.
Dynamic Table Selection
The dynamic table option allows specification of a table using text and variables. This is useful when employing variable driven workflows where the table or view references are relative to the variables specified.
An example that uses the current_month variable to dynamically point to a table:
legal_entity/inputs/{current_month}/ledger_values
Static Table Selection
When a specific table is desired as the source, leave the Dynamic box unchecked and select the source table using the dropdown menu.
Table Explorer is always avaible with any table selection. Click on the Table Explorer button to the right of the table selection and a Table Explorer window will open.
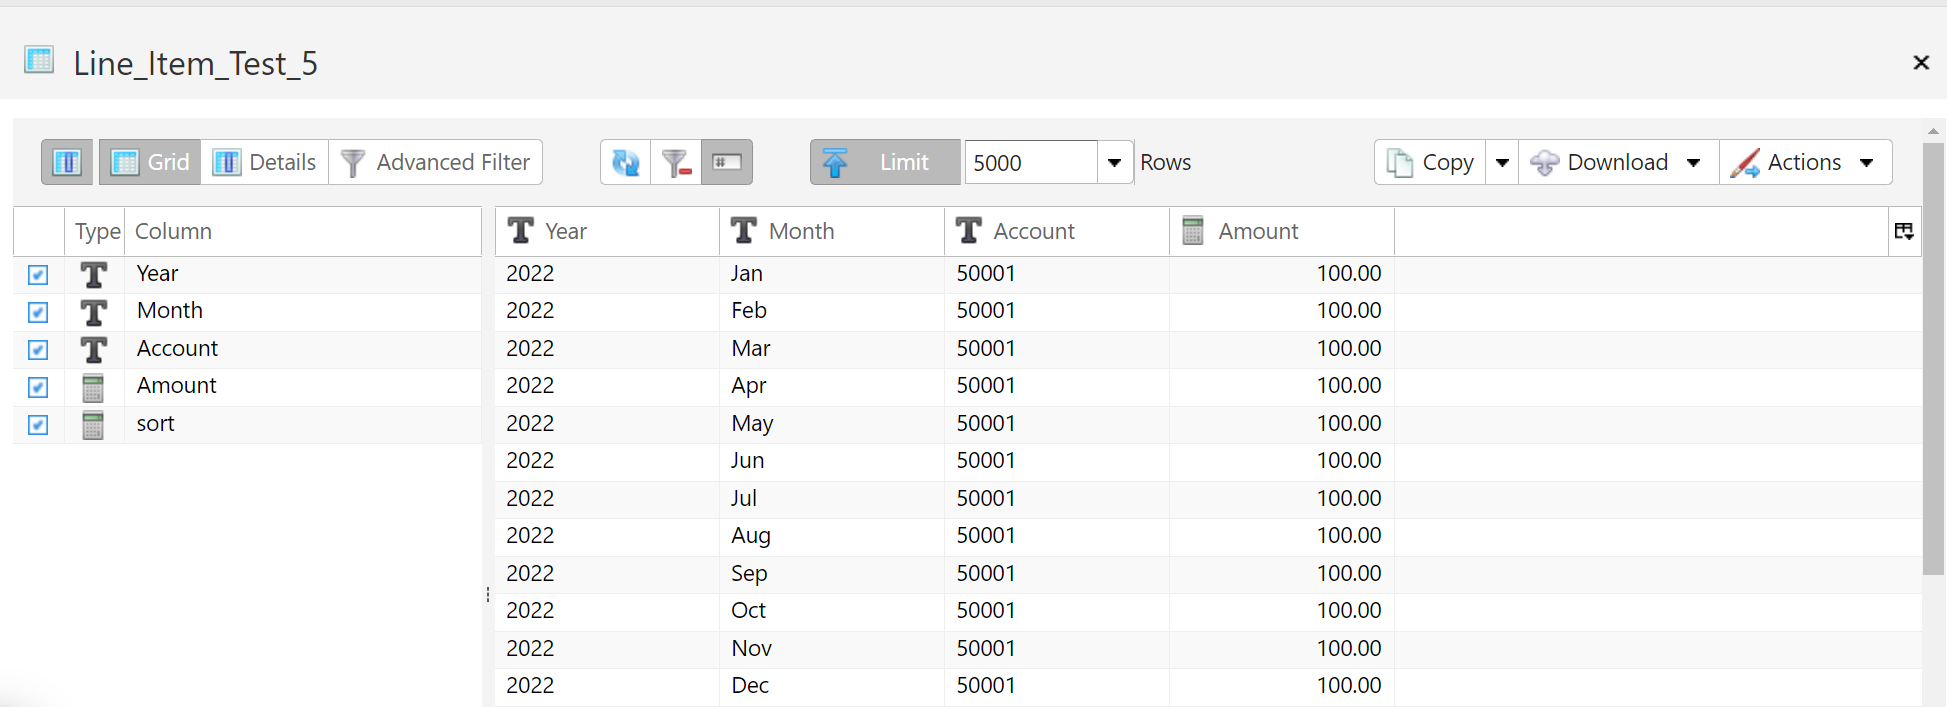
Source Table
This is the table that contains the data that you wish to add the attributes from the Assignment Dimension to.
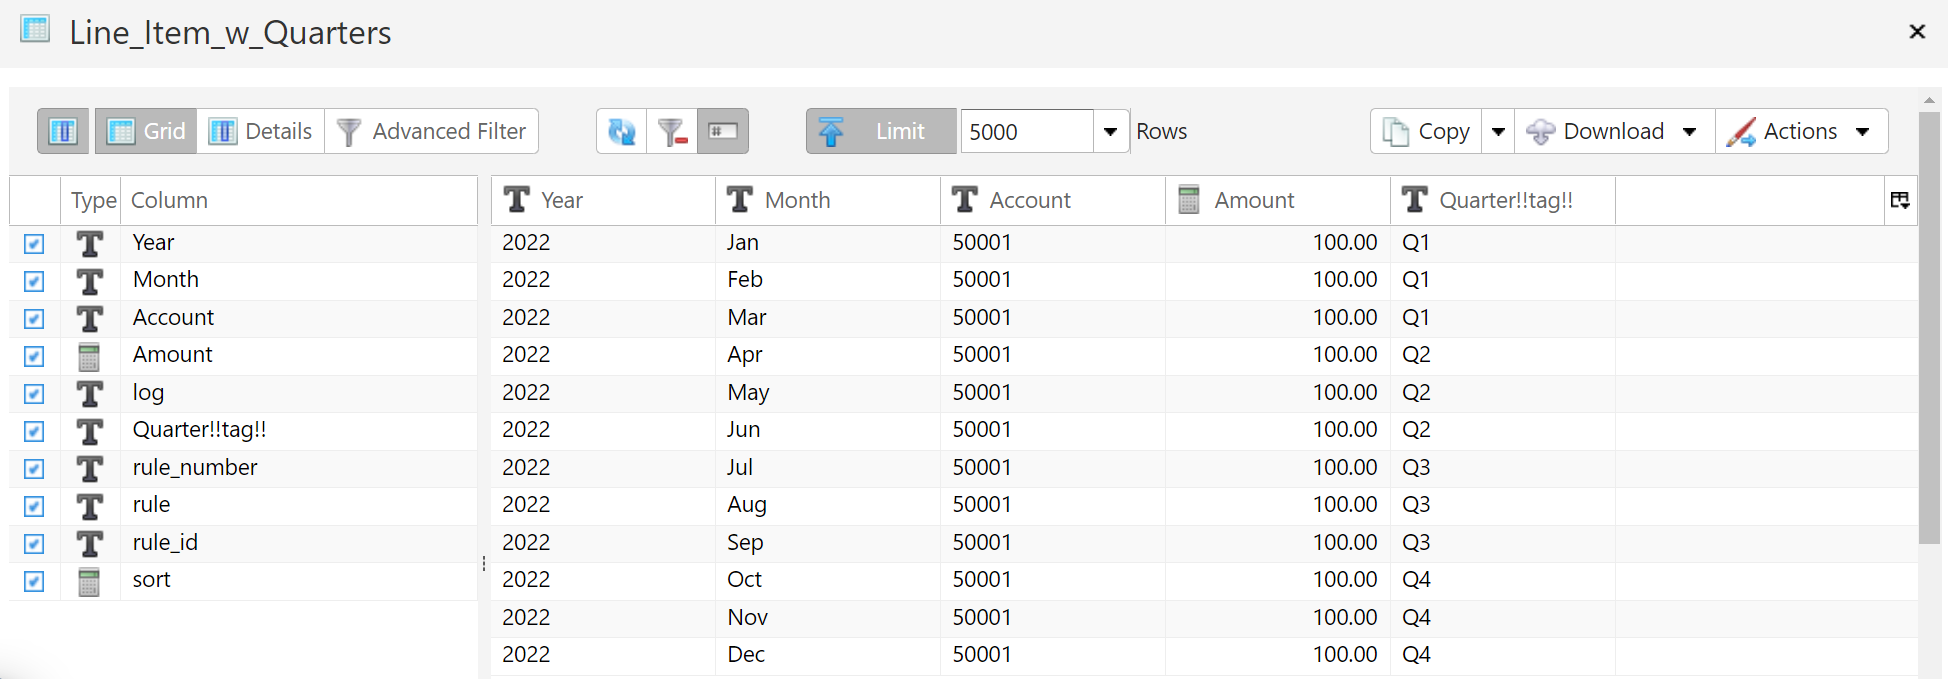
Tagging Result Table
The Tagging Result Table will contain the data from the Source Data Table with the attributes contained in the Assignment Dimension Hierarchy.
Assignment Dimesion Hierarchy
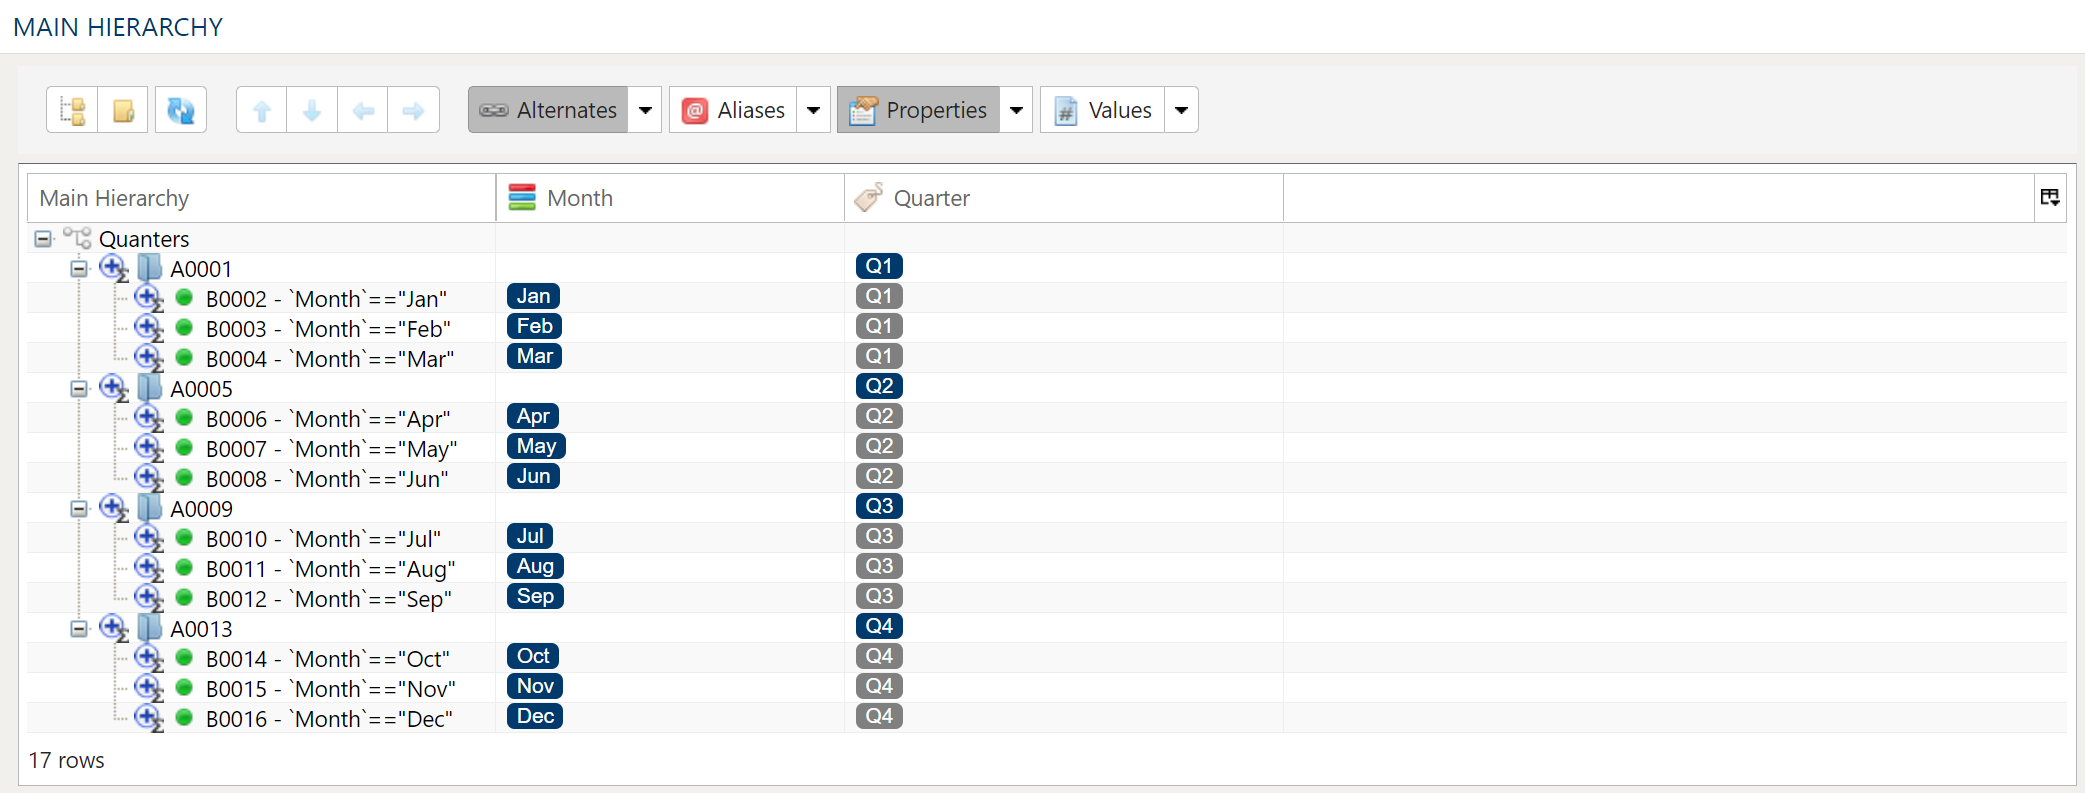
The Assignment Dimension Hierarchy gives the user the ability to point, click and filter the Source Table to add attributes to the Tagging Result Table. The Assignment Dimension Hierarchy is created by combining dimensions that reference the Source Table.
Creating An Assignment Dimension Hierarchy
To create the Assignment Dimension Hierarchy you must first create the dimensions you wish to use to as filters for the Source Table. The links below will guide you through creating these dimensions.
Creating The Main Hierarchy
Once the dimensions for the Source Table have been created the next step is to decide which of the dimensions for the Source Table will serve as the Main Hierarchy for the Assignment Dimension Hierarchy.
Copy this dimension by navigating to the Dimensions tab in PlaidCloud, clicking on the dimension and then selecting Actions and Copy Dimension. When you copy the dimension a pop-up will apprear asking you to enter a name for the copied dimension.
Adding Dimensions To The Assignment Hierarchy
Open the newley created Assignment Dimension, click on the down arrow next to Properties and select New Property.
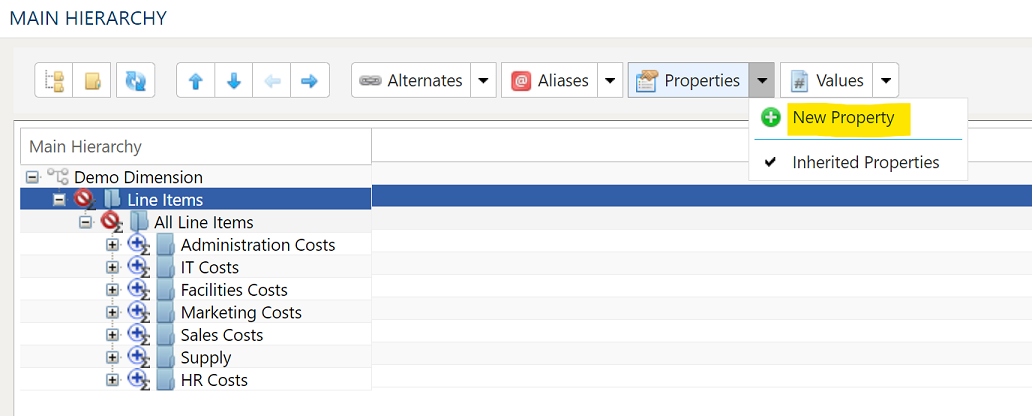
This will open the Property Configuration dialog box:
Property Configuration
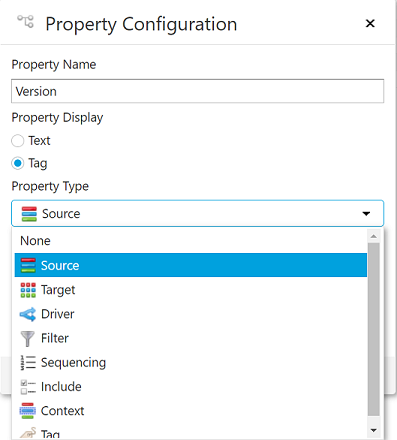
Property Name - This is normally the name of the dimension that is being added to the Assignment Hierarchy.
Property Display - This should be set to "Tag".
Property Type - For Rule Based Tagging property type should be set to Source.
- Source - Is used in conjunction with the Source Table.
Editor Type - This drop down should be set to Select Dimension.
Once the appropriate properties have been selected for the dimension being added to the Assignment Hierarchy select "Edit Configuration".
Dimension Configuration
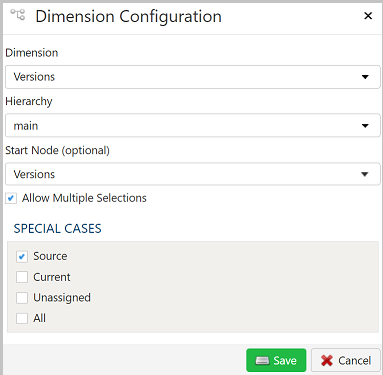
- Dimension - Use the drop down to select the dimension.
- Hierarchy - If the dimension selected has alternate hierarchies, then they will appear and be selectable here as well as the main hierarchy.
- Start Node - If you don't wish the dimension to be displayed from the top node you can select any node within the hierarchy as the node from which the dimension will be displayed.
- Allow Multiple Selections - If checked the user will be able to select multiple nodes in the hierarchy.
- Special Cases - Are not used in Rule Based Tagging.
Source Map
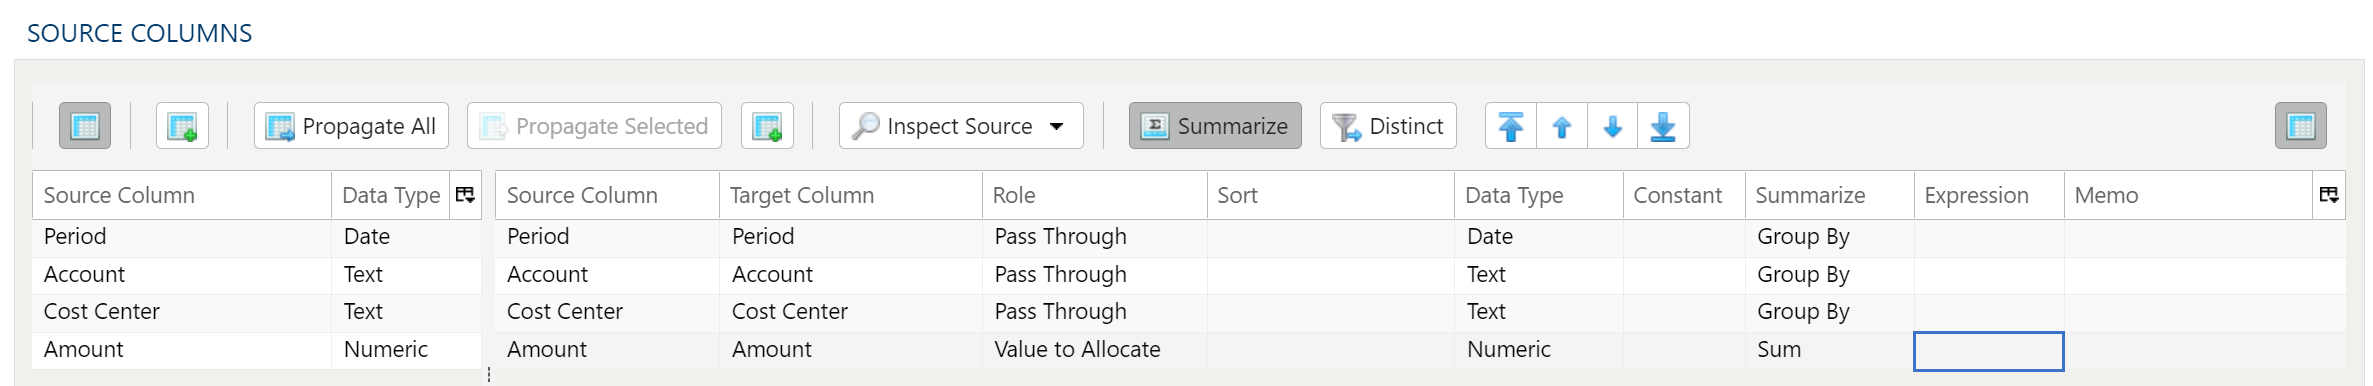
The Allocation Source Map is used to map the columns from the Values To Allocate Table that will be used in the allocation step.
Inspection and Populating the Mapper
Using the Inspect Source menu button provides additional ways to map columns from source to target:
- Populate Both Mapping Tables: Propagates all values from the source data table into the target data table. This is done by default.
- Populate Source Mapping Table Only: Maps all values in the source data table only. This is helpful when modifying an existing workflow when source column structure has changed.
- Populate Target Mapping Table Only: Propagates all values into the target data table only.
If the source and target column options aren’t enough, other columns can be added into the target data table in several different ways:
- Propagate All will insert all source columns into the target data table, whether they already existed or not.
- Propagate Selected will insert selected source column(s) only.
- Right click on target side and select Insert Row to insert a row immediately above the currently selected row.
- Right click on target side and select Append Row to insert a row at the bottom (far right) of the target data table.
Role
Each column in the data mapper must be assigned a role:
- Pass Thought - These columns will appear in the allocation results table.
- Value to Allocate - This is the column that contains the values to be allocated.
Deleting Columns
To delete columns from the target data table, select the desired column(s), then right click and select Delete.
Chaging Column Order
To rearrange columns in the target data table, select the desired column(s). You can use either:
- Bulk Move Arrows: Select the desired move option from the arrows in the upper right
- Context Menu: Right clikc and select Move to Top, Move Up, Move Down, or Move to Bottom.
Reduce Result to Distinct Records Only
To return only distinct options, select the Distinct menu option. This will toggle a set of checkboxes for each column in the source. Simply check any box next to the corresponding column to return only distinct results.
Depending on the situation, you may want to consider use of Summarization instead.
The distinct process retains the first unique record found and discards the rest. You may want to apply a sort on the data if it is important for consistency between runs.
Aggregation and Grouping
To aggregate results, select the Summarize menu option. This will toggle a set of select boxes for each column in the target data table. Choose an appropriate summarization method for each column.
- Group By
- Sum
- Min
- Max
- First
- Last
- Count
- Count (including nulls)
- Mean
- Standard Deviation
- Sample Standard Deviation
- Population Standard Deviation
- Variance
- Sample Variance
- Population Variance
- Advanced Non-Group_By
For advanced data mapper usage such as expressions, cleaning, and constants, please see the Advanced Data Mapper Usage
Source Filters
To allow for maximum flexibility, data filters are available on the source data and the target data. For larger data sets, it can be especially beneficial to filter out rows on the source so the remaining operations are performed on a smaller data set.
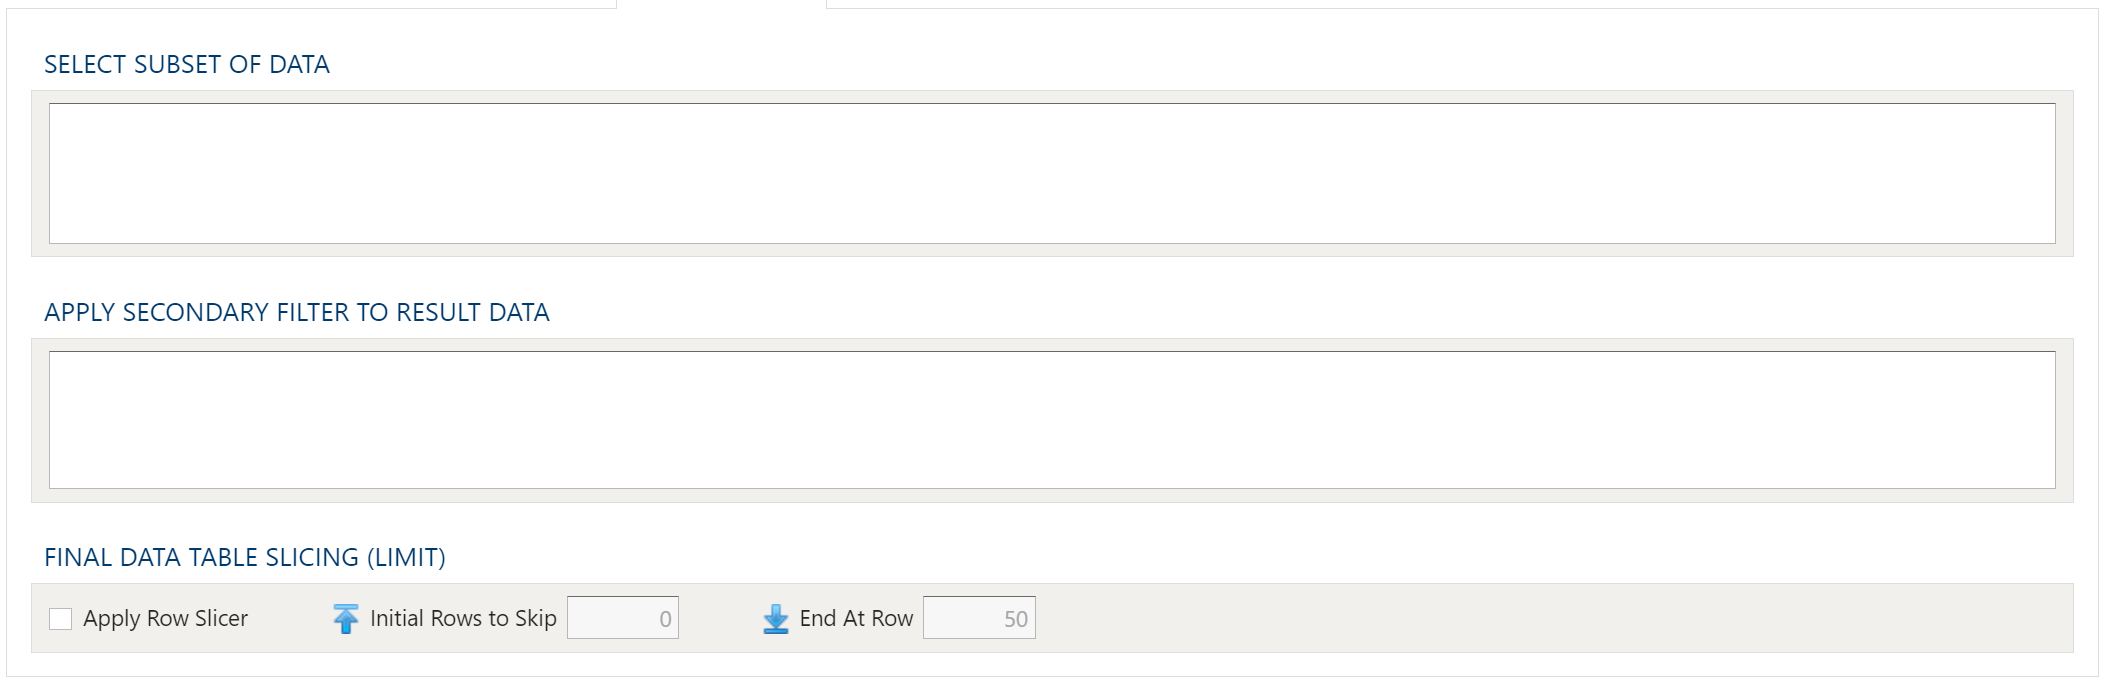
Select Subset Of Data
This filter type provides a way to filter the inbound source data based on the specified conditions.
Apply Secondary Filter To Result Data
This filter type provides a way to apply a filter to the post-transformed result data based on the specified conditions. The ability to apply a filter on the post-transformed result allows for exclusions based on results of complex calcuations, summarizaitons, or window functions.
Final Data Table Slicing (Limit)
The row slicing capability provides the ability to limit the rows in the result set based on a range and starting point.
Filter Syntax
The filter syntax utilizes Python SQLAlchemy which is the same syntax as other expressions.
View examples and expression functions in the Expressions area.